Rhoda Scales Web Video and the Bearings Come Out Faster
Rhoda AI asked a blunt question: if you pre-train a video model on ordinary web clips, with no robot actions in them, does a bigger or longer run actually help a factory cell? On 10 September, Tongzhou Mu and the Rhoda team published the measurement. Humanoids Daily picked it up on 15 September.
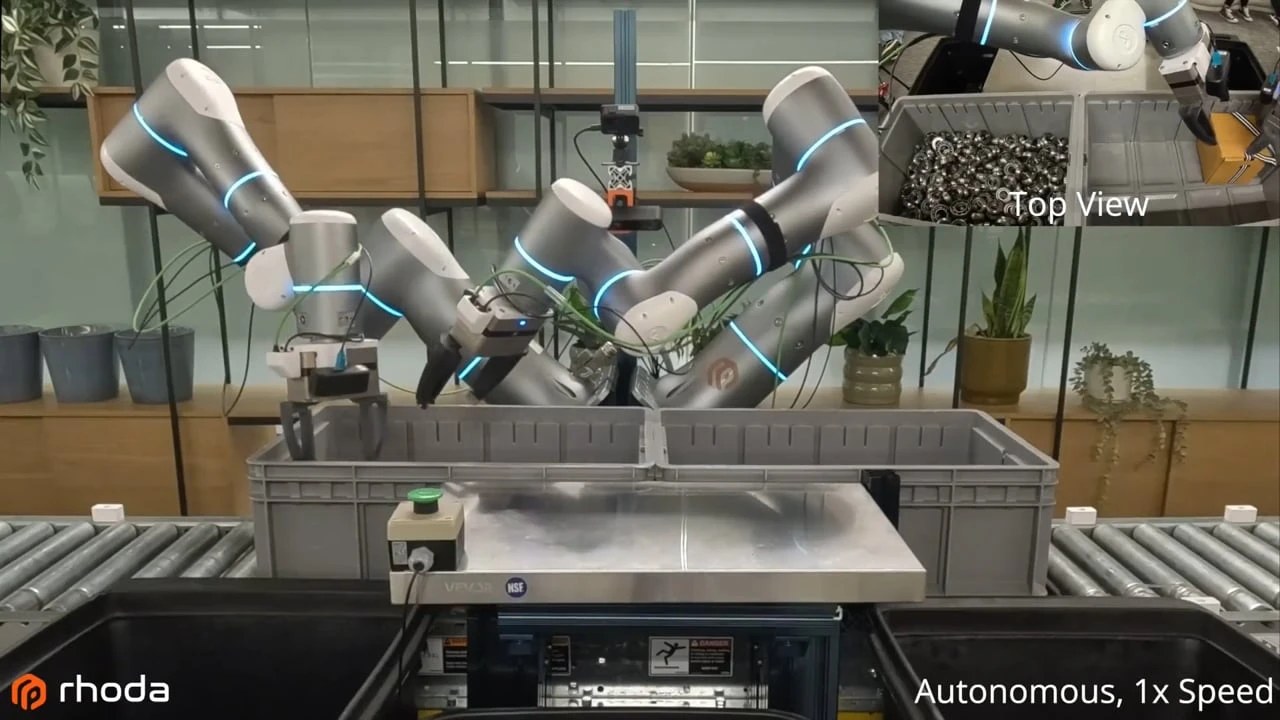
The task is not a cube on a table. A customer unpacks more than 1,000 bearing boxes a day by hand. Each box weighs 10 kg. The robot has to lift it, find the tab, open the lid, dump the bearings, and sort cardboard, plastic, and paper. A trial counts only if every goal is met with no human help and the cycle finishes under 100 seconds.
Size first, then compute
Rhoda’s Direct Video-Action model predicts future frames, then a separate inverse-dynamics model turns those frames into joint commands. That inverse model stays fixed. Only the pre-trained video net changes.
Four sizes, one recipe, full demonstration set:
| Size | At-speed completion | Trials |
|---|---|---|
| XS | 3.7% | 1/27 |
| S | 65.0% | 67/103 |
| M | 75.3% | 195/259 |
| L | 84.7% | 94/111 |
The team stopped XS after 27 trials once it was clearly worse. They say the L model has not saturated the metric.
Holding size at M and scaling pre-training compute from 0.08× to 1× of the full run moved the rate 57.8% → 67.3% → 74.5% → 75.3%. The last step is flat at full task data. Cut the demonstrations and the gap opens: at 25% of the post-training set, the spread between the largest and smallest compute budgets reaches 31 points.
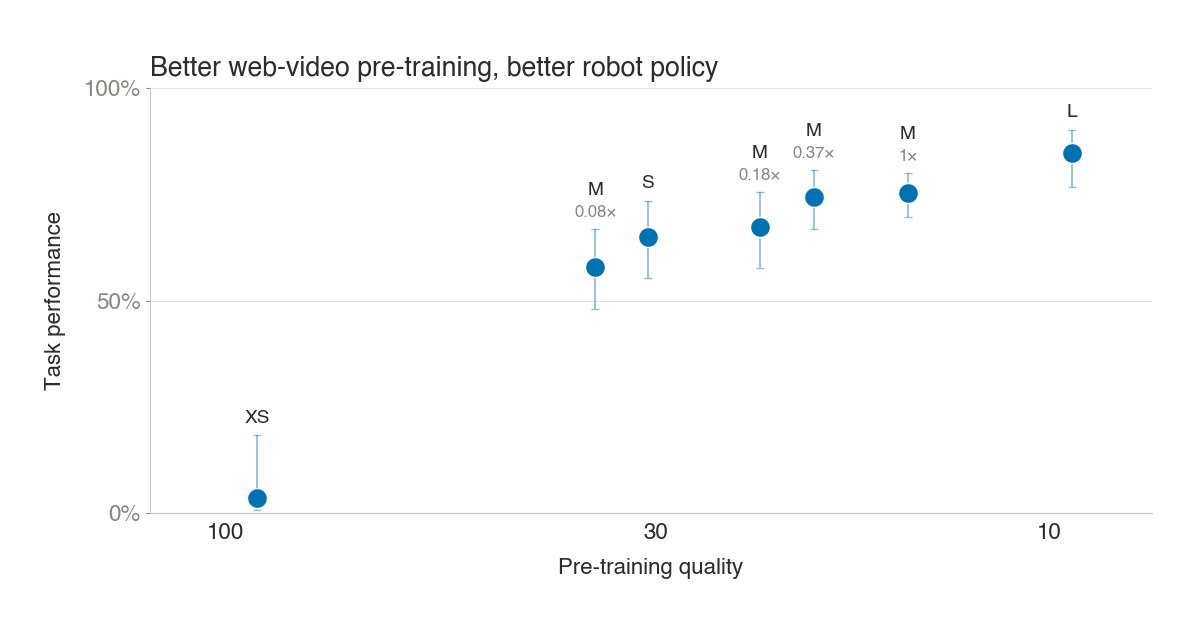
A cheap pre-training score, DINO FD on held-out web video, ranked the seven checkpoints in the same order the robot did. Lower distance, higher completion, from 4% on the left to 85% on the right.
The evaluations ate more than 200 robot hours. Each policy got about 100 to a few hundred trials under a written SOP. The 100-second cutoff is stricter than the customer’s own limit, on purpose, so the score does not saturate.
Rhoda lists the limits in the same post: one task, one cell, one post-training run per condition. Larger models also saw more video, so the size sweep is not compute-matched.
A Human’s Take
This is the rare scaling chart I trust because they published the failure modes. Bigger models mostly win on time, not on “did the bearings land in the tote.” They retry less and move faster. Waste mis-sorts even tick up a bit when the policy commits before it has looked long enough. That is a real factory trade, and they measured it instead of waving a success rate.
Sources
- Rhoda AI — Does Scaling Web-Video Pre-training Help Real Robots Do Real Work?
- Humanoids Daily — Rhoda Tests Whether Scaling Web-Video Pretraining Makes Robots Better at Real Work